
uPresenter Beta Updates on Jan 10: Support Charts & Preview on Canvas
uPresenter now supports Charts, allowing you to visualize data seamlessly. Additionally, you can preview animations and transitions directly on the Canvas, making content creation more intuitive and efficient.
Support Charts
Charts are now supported in the uPresenter editor to visualize data in your presentations. This feature helps you create engaging and data-driven presentations with ease.
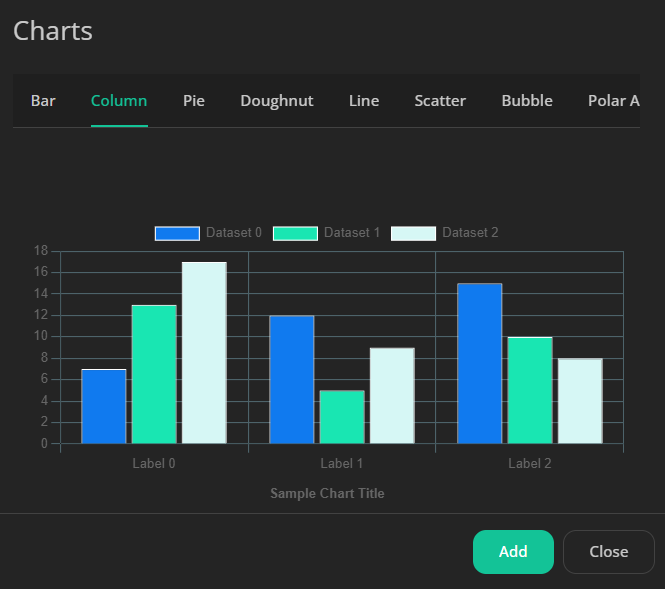
- To add charts, open the Elements gallery, you can see the Chart button at the bottom in the Miscellaneous section.
- The Chart window pops up, choose from various chart types like bar, line, or pie chart, then click on the Add button.
- Change the default data to your own data in the Edit Chart Data table.
- Optionally adjust more chart properties such as title, legends, axis labels, data labels in the Properties pane on the right side.
For more information, refer to Add and Customize Charts in uPresenter.
Preview Animations & Transitions on Canvas
uPresenter makes it easy to preview animations and transitions before applying them. When selecting an effect, simply hover your mouse over each transition or animation, and a real-time preview will play directly on the Canvas.
This allows you to quickly compare effects and choose the one that best fits your presentation. With this feature, you can create smooth and engaging slide transitions more efficiently than ever.
That’s it. Be sure to visit our official website regularly to gain a deeper understanding of our product, check out the Changelog site for the latest updates, and explore our Blog for exciting news and insightful posts on AI and education.
Looking forward to seeing you again in future updates!